

Dynatrace is an all-in-one platform that’s purpose-built for Infrastructure monitoring, Applications and microservices monitoring, Application security, digital experience monitoring, business analytics, and Automation with AI support.
There are two ways to set up a Dynatrace operator to monitor your Kubernetes cluster. One is using CRD, and another one is using Helm.
Dynatrace operator that manages the lifecycle of several Dynatrace components such as OneAgent, routing, and Kubernetes API Monitor. Additional components will be added as new observability features become available.
Prerequisites
- Kubernetes version 1.20+
- Install Helm v3
- Ensure pods have egress permissions to your Dynatrace environment or your activeGate for metric routing to function correctly.
Tokens and permissions
- Create an API token in your Dynatrace environment and enable the following permissions.
- Access problem and event feed, metrics, and topology (
DataExport) - PaaS integration — Installer Download (
InstallerDownload) - Create activeGate tokens1 (
activeGateTokenManagement.create) - Optional If you want Dynatrace Operator to automatically handle the connection to ActiveGate via public API for Kubernetes monitoring, be sure also to enable the following permissions:
- Read entities (
entities.read) - Read settings (
settings.read) - Write settings (
settings.write)
2. For Cloud Native FullStack and application monitoring deployments, in addition to the API token, you also need to generate a dataIngestToken token for metadata metric enrichment and enable the Ingest metrics (metrics.ingest) permission.
Automated: The automated mode provides a simple setup with basic configuration using the Dynatrace web UI.

Instructions for automated mode:
1. In the dynatrace menu, go to Kubernetes.
2. Select Connect automatically via Dynatrace Operator.
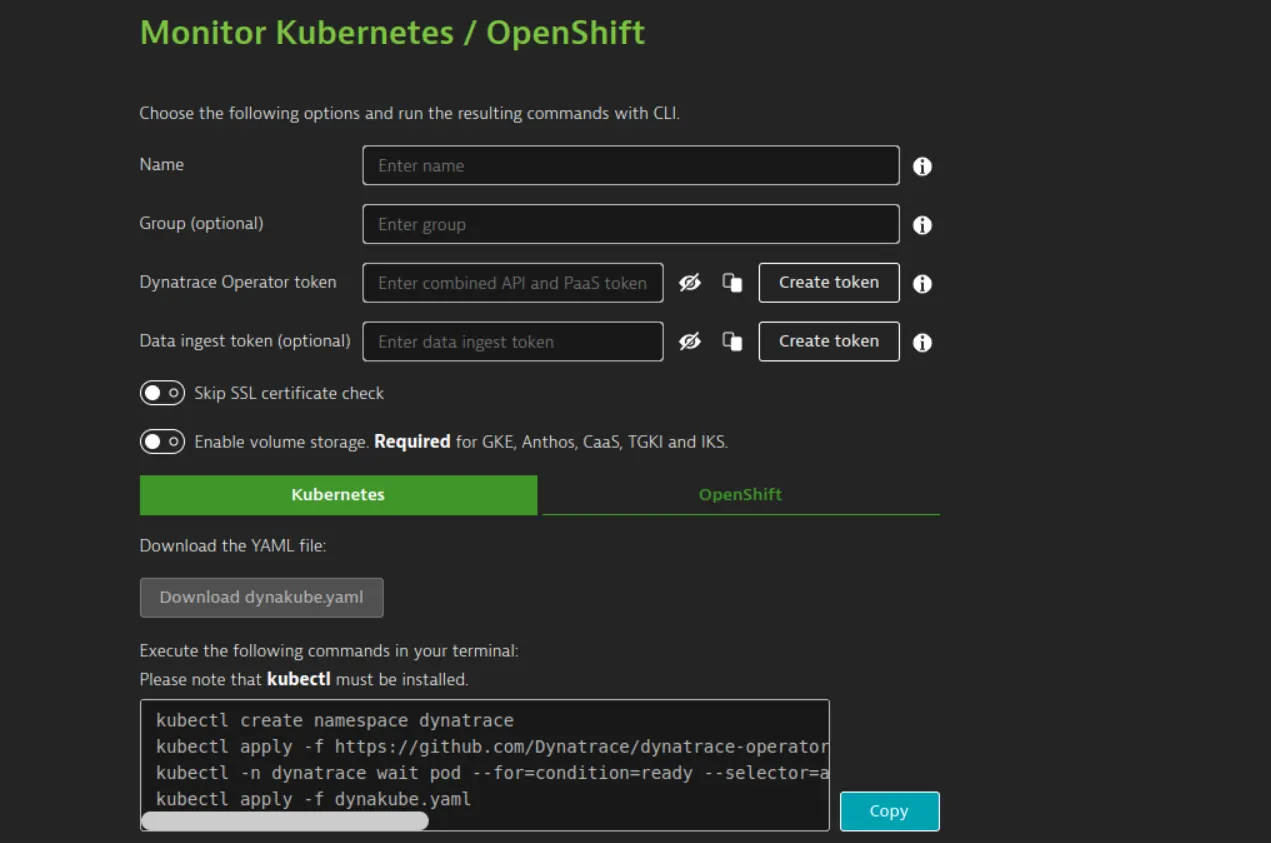
3. Enter the following details.
- Name: Defines the display name of your Kubernetes cluster. Additionally, this name is used as a prefix for naming Dynatrace-specific resources inside the Kubernetes cluster, such as DynaKube (custom resource), ActiveGate (pod), and OneAgents (pods), and as a name for the secret holding your tokens.
- Group(optional): Defines a group used by various Dynatrace settings, including network zone, activeGate group, and host group. If not set, defaults or empty values are used.
- Dynatrace Operator token: Select Create token to automatically generate the token and the necessary permissions.
- optional Data ingest token: For
cloudNativeFullStackandapplicationMonitoringdeployments, if you want to enable metadata metric enrichment, select Create token.
4. Select whether you want dynatrace to check your ssl certificate(optional).
5. For gke, Anthos, CaaS, TGKI, and IKS, turn on Enable volume storage
6. Under kubernetes/OpenShift, select Download dynakube.yaml, and then copy the code block created by Dynatrace based on your input from previous steps and run it in your terminal. Be sure to execute the commands in the same directory where you downloaded the YAML, or adapt the commands to link to the location of the YAML.
Manual Mode:
- Create a Dynatrace Namespace.
kubectl create namespace dynatrace
2. Install the Dynatrace operator
For classicFullStack, ApplicationMonitoring without csi driver, and hostMonitoring when read-only is disabled, run the command below.
kubectl apply -f https://github.com/Dynatrace/dynatrace-operator/releases/download/v0.12.0/kubernetes.yaml
For cloudNativeFullStack, applicationMonitoring with CSI driver, and hostMonitoring when read-only isn’t disabled, run the commands below.
kubectl apply -f https://github.com/Dynatrace/dynatrace-operator/releases/download/v0.12.0/kubernetes.yaml
kubectl apply -f https://github.com/Dynatrace/dynatrace-operator/releases/download/v0.12.0/kubernetes-csi.yaml
3. Create a secret holding your tokens
For ClassicFullStack, create a secret named dynakube holding the API token obtained in Tokens and permissions required. Be sure to replace the placeholder (<...>) with your value.
Kubectl -n dynatrace create secret generic dynakube — from-literal=”apiToken=<API_TOKEN>”
For CloudNativeFullStack and applicationMonitoring, create a secret named dynakube holding both the API token and the see Tokens and permissions required. Be sure to replace the placeholders (<...>) with your values.
kubectl -n dynatrace create secret generic dynakube — from-literal=”apiToken=<API_TOKEN>” — from-literal=”dataIngestToken=<DATA_INGEST_TOKEN>”
5. Download a Preconfigured Dynakube custom resource sample.
https://github.com/Dynatrace/dynatrace-operator/tree/v0.11.2/assets/samples
6. Review the parameters
7. After changing dynakube file according to your requirement, apply it.
kubectl apply -f <your-DynaKube-CR>.yaml
We can also install Dynatrace using Helm
Installation Steps:
- Add Dynatrace helm repo
helm repo add dynatrace https://raw.githubusercontent.com/Dynatrace/dynatrace-operator/main/config/helm/repos/stable
2. Install Dynatrace Operator
helm install dynatrace-operator dynatrace/dynatrace-operator \
— set “installCRD=true” \
— atomic \
— create-namespace — namespace dynatrace
Note: For additional configuration to the helm chart, edit the values.yaml sample from GitHub
3. Create the custom resource definition
- If installCRD is set to
true, the custom resource definition will be automatically created and managed by Helm. - If installCRD is set to
false, you need to create the custom resource definition manually before starting the Helm installation:
kubectl apply -f https://github.com/Dynatrace/dynatrace-operator/releases/download/v0.12.0/dynatrace-operator-crd.yaml
Collecting Kong API-Gateway metrics
- Enable the Prometheus plugin using Kong ui or through Api request.
- Create a service for the Prometheus plugin.
- Add the following annotations to the Kong deployment resource in the spec > template > metadata section.
metrics.dynatrace.com/scrape: 'true'
    metrics.dynatrace.com/path: '/metrics'
    metrics.dynatrace.com/port: '8001'
    metrics.dynatrace.com/secure: 'false'
To See K8s metrics click on Kubernetes from the left side menu. You will see your cluster information.

Click on cluster it will show all the information.


It will also give namespace-level information.

It will pod level information.

Click on hosts to see all the host metrics.


